Endpoint-to-Technician Ratio: What It Is, What the Benchmarks Say, and How to Improve Yours
TL;DR
The endpoint-to-technician ratio is one of the most watched - and most misread - metrics in MSP operations. The widely cited "industry average" of 100:1 is real, but it doesn't tell you whether 100:1 is sustainable for your shop. The profitable sweet spot, based on ISG, Datto, and ConnectWise benchmarking data, lands at 85–125 endpoints per technician - assuming mature RMM, good customer mix, and documented processes. Below that, you're leaving margin behind. Above it without serious automation, you're burning out your team. The most important thing happening right now: AI agents that autonomously resolve Level 1 tickets are starting to break the ceiling entirely, with early adopters reporting sustainable ratios of 150–250+:1. If your ratio feels wrong, it probably is - and the fix is almost never "hire another tech."
What the endpoint-to-technician ratio actually measures
The endpoint-to-technician ratio is straightforward in concept: take your total managed endpoints, divide by the number of active technicians, and you get the ratio. An MSP with 500 managed devices and 5 technicians has a ratio of 100:1.
What counts as an "endpoint" is where it gets interesting. The working definition for fully managed services includes:
- Workstations and laptops - every user device under active management
- Servers (physical and virtual) - often weighted more heavily in practice since they generate disproportionate ticket volume
- Network infrastructure - routers, switches, firewalls, when under active management
- Mobile devices - only if fully managed, not just enrolled in MDM
Co-managed arrangements complicate things, because the split of responsibilities varies by customer. A device in your RMM that a customer's internal IT team actually manages shouldn't count the same way as one your team is fully responsible for. Most experienced MSP operators use a "work units" adjustment - a server might count as 2–3 endpoints, a simple workstation as 0.8 - to better reflect actual workload rather than raw device count.
The ratio is valuable precisely because it's a forcing function. It makes visible a tension that's otherwise easy to paper over: how much work are you actually taking on per head, and can your team sustain it?
Why this metric is notoriously context-dependent
Here's the thing that makes endpoint-to-technician ratio conversations frustrating in forums: the same number means completely different things at different shops.
An MSP running 105:1 with a mid-market customer base - companies that have an internal IT coordinator, standardized laptop builds, and low user-generated ticket volume - is having a completely different operational experience than an MSP at 95:1 with a portfolio of 15-person law firms and dentist offices. The second shop's technicians are drowning; the first shop's are fine.
Community discussions on r/msp make this tension explicit:
"We had 95:1 with SMBs but the tickets were nonstop - users doing stupid stuff, no IT staff on their end. After shifting to mid-market customers with actual IT people, we're at 105:1 and way more sane. The ratio matters way less than customer quality." - Senior Tech, r/msp (2025)
Three variables matter at least as much as the raw ratio number:
Customer maturity. SMBs with no internal IT generate higher ticket volume per endpoint than mid-market companies where an IT coordinator handles first-line issues. The same 100 endpoints feel very different depending on who's sitting behind them.
Service model. Fully managed services with SLA commitments require proactive monitoring and maintenance that co-managed or break/fix arrangements don't. ConnectWise's benchmarking data consistently shows fully managed MSPs operating at 50–100:1, while break/fix shops run 150–250+:1 - not because they're more efficient, but because they're doing fundamentally different work.
Automation depth. This one is the biggest multiplier, and we'll cover it in detail below.
What the benchmarks actually say
Published benchmark data from ISG's MSP Provider Lens reports, Datto's State of the MSP surveys, and ConnectWise's benchmarking studies tell a consistent story when you cross-reference them.
| MSP segment | Typical ratio | Key driver |
|---|---|---|
| Small MSP (1–5 techs) | 60–100:1 | Multi-hat roles, lower utilization, less specialization |
| Mid-market MSP (6–20 techs) | 90–140:1 | Better specialization, moderate automation |
| Enterprise MSP (20+ techs) | 120–180+:1 | Advanced automation, specialized teams |
| Fully managed services | 50–100:1 | High SLA expectations, proactive work |
| Co-managed services | 100–150:1 | Shared responsibility with customer IT |
| Break/fix | 150–250+:1 | Reactive only, minimal proactive work |
| Security/compliance-focused | 30–70:1 | Complex, specialized, audit-heavy |
The 2025 ISG MSP benchmarking data shows mid-market MSPs averaging 95–110:1 across service models. Datto's most recent State of the MSP report found top-quartile MSPs averaging 120:1, with bottom-quartile shops averaging just 55:1 - suggesting the gap between well-run and poorly-run operations is wide. N-able's operational insights show that MSPs with mature automation tools report 20–30% higher ratios than those running basic tooling.
The ConnectWise data surfaces a useful signal: profitable MSPs cluster between 90–130:1; unprofitable MSPs tend to fall either below 70 (underutilized) or above 180 (unsustainably overloaded). The tails are both bad, just for different reasons.
The profitable sweet spot - and why it has hard edges
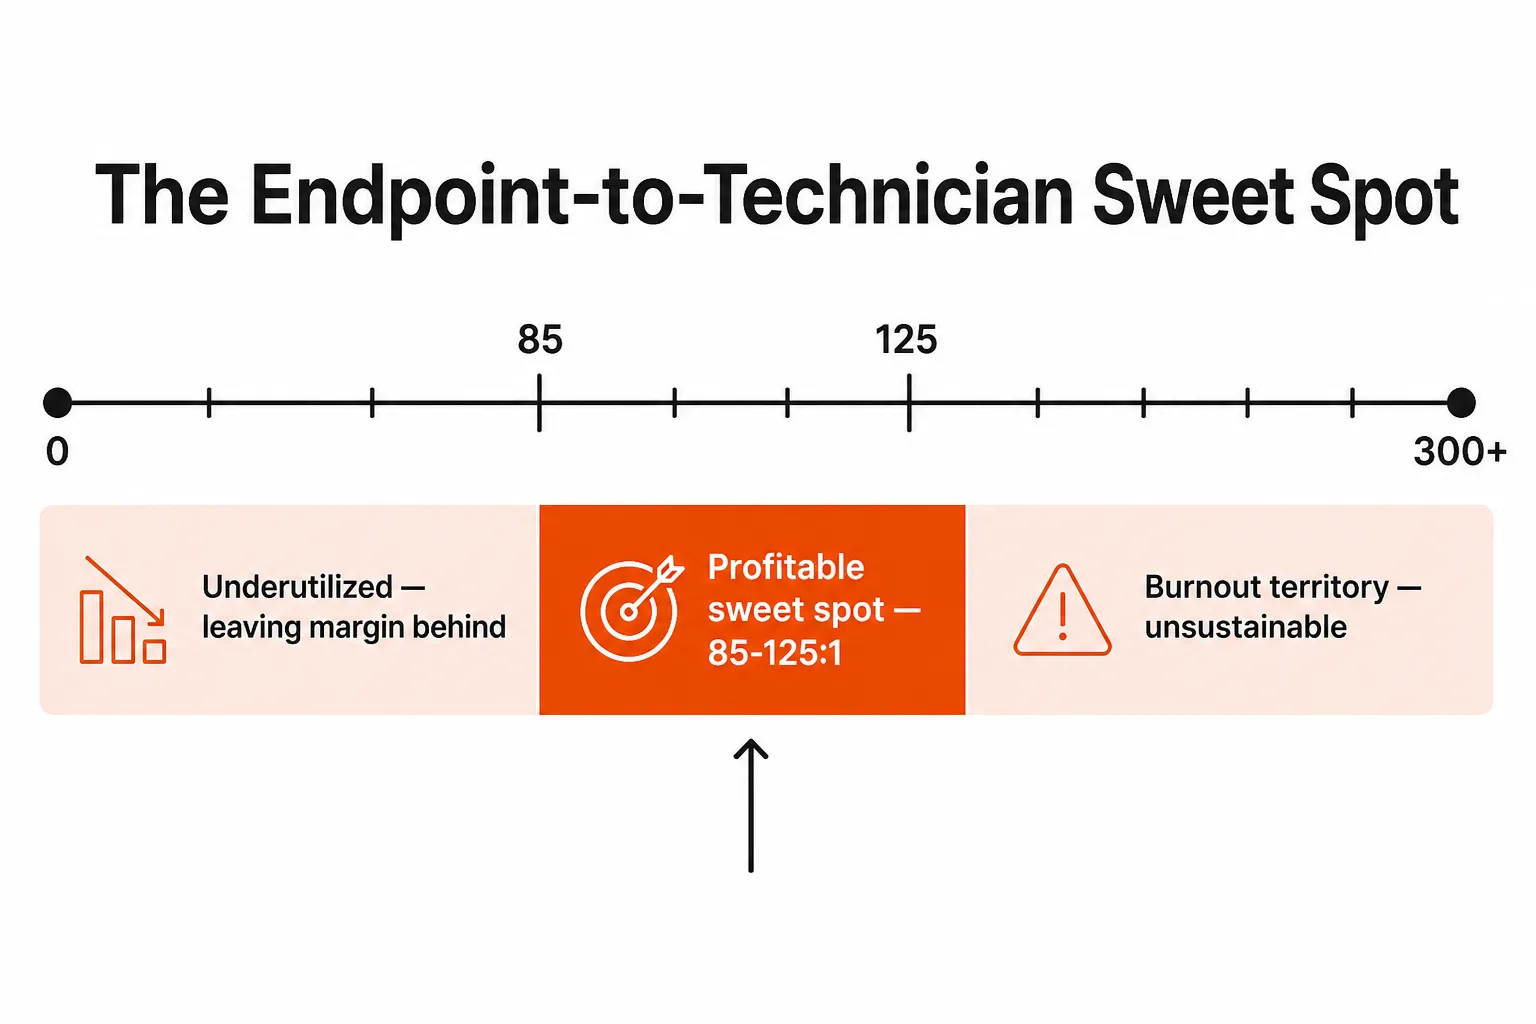
The data converges on a range: 85–125 endpoints per technician is where most MSPs achieve healthy margins without destroying their team. Experienced operators who've run multiple cycles seem to land there independently of each other.
"I've been in this industry 15 years. The sweet spot is 90–120 endpoints per tech. Below that you're leaving money on the table. Above that you're leaving your team's sanity on the table. Everything else is theory." - MSP Operator, r/msp (2025)
Below 85:1 typically signals one of a few things: a deliberately premium service model (boutique, high-SLA, high-margin), a new MSP still building its customer base, or underinvestment in automation tools. The math still works if you're charging enough - but most shops at this ratio are leaving capacity on the table.
Above 125:1 without serious automation is a different story. This is where burnout starts accumulating even when the ratio looks defensible on paper. The stress isn't distributed evenly - it tends to hit your most experienced people hardest, because they're the ones who can actually handle the overflow.
"Everyone says 100:1 is the norm now, but at 80:1 I was already burned out. The industry benchmark might be 100+, but that doesn't mean everyone can handle it. Started hiring more and dropped to 60:1 - my team actually has a life now." - Tech Lead, r/msp (2024)
That quote is worth sitting with. The published benchmark describes what MSPs do, not what they can sustain. Those aren't the same number.
Why automation is the only real lever
If you push on the endpoint-to-technician ratio hard enough, you almost always end up at the same underlying question: how much of this work has to involve a human? The answer has changed dramatically over the past several years.
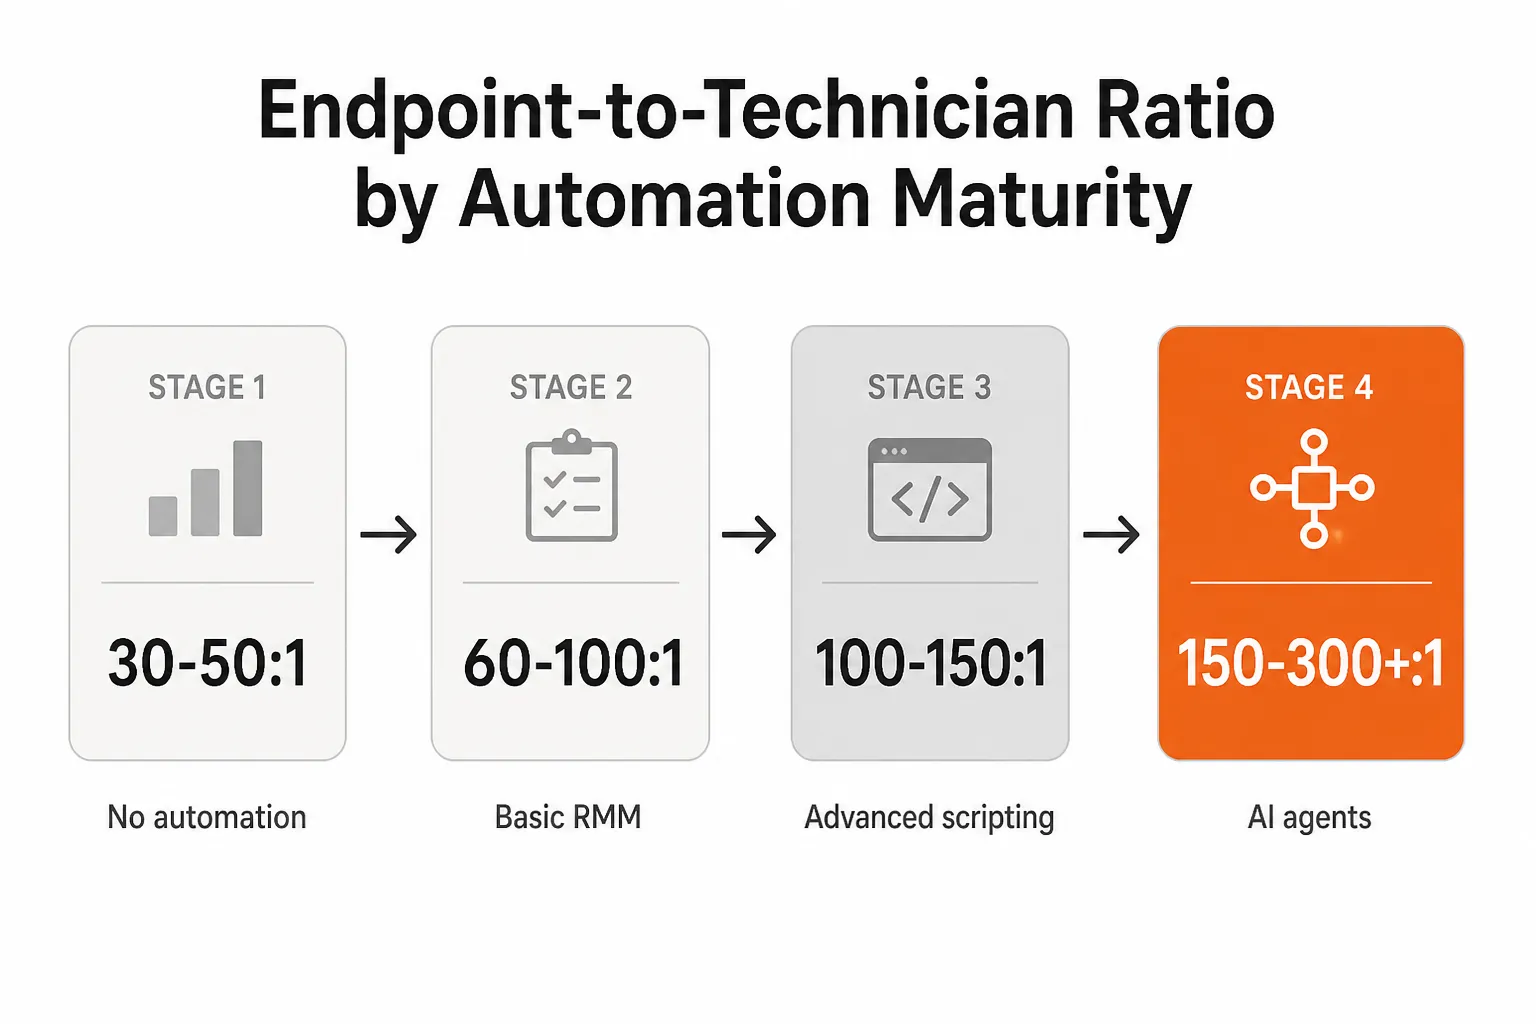
Without any automation, a sustainable ratio is roughly 30–50:1. Everything is reactive. Every ticket requires someone to read it, triage it, connect to the endpoint, and do the work manually.
With basic RMM - monitoring, automated patching, remote access - you get to 60–100:1. You catch problems before users call, and routine maintenance happens without anyone manually scheduling it.
With advanced RMM plus scripting - bulk remediation, automated compliance checks, intelligent alerting - well-run shops push to 100–150:1. At this tier, 50–70% of common issues resolve without a technician actively doing anything.
With AI-powered autonomous resolution - the next tier that's now available - early adopters are reporting 150–300+:1. This isn't about faster triage or better routing. It's about Level 1 tickets never reaching a technician in the first place.
"It's not 'endpoints per tech' - it's 'what tools have you given your techs.' We invested in Datto, ConnectWise, and good scripting. Now we're at 140:1 and honestly fine. Shops with Zendesk and a ticket queue? They're underwater at 70:1." - MSP Director, r/msp (2025)
The practical translation: if you're trying to improve your ratio by hiring, you're running on a treadmill. Every new tech raises your capacity but also raises your cost base. Automation shifts the underlying economics permanently - you get more work out of the team you already have.
What actually drives your ratio up or down
The endpoint-to-technician ratio is a symptom, not a cause. You can't directly improve it - you can only change the underlying conditions it reflects. Those conditions sort into a short list.
Things that kill your ratio (force it down):
- SMB-heavy customer mix - high ticket volume per endpoint, no internal IT buffer, users with low technical sophistication
- No or weak RMM automation - everything is reactive; technicians touch most tickets
- Poor ticket triage - misrouted tickets waste time; Level 1 issues land on Level 2 people
- High-touch SLAs - 4-hour response windows on routine issues pull senior people into grunt work
- Custom, non-standard builds - every customer environment is different; troubleshooting takes longer
Things that multiply your ratio (push it up):
- Mid-market customer mix - customers with internal IT staff buffer ticket volume and handle first-line issues
- Advanced RMM and scripting - common remediations run automatically; technicians handle exceptions
- AI ticket resolution - Level 1 issues close without a technician opening the ticket
- Standardized builds - identical configurations across customers mean faster, scriptable troubleshooting
- Self-service for users - password reset portals, IT knowledge bases, chatbots absorb simple requests
The most consistent finding across industry data and community experience: customer quality has at least as much impact on ratio sustainability as raw endpoint count. An MSP at 95:1 with a well-curated customer portfolio will outperform an MSP at 80:1 with a sprawling SMB base - in margin, in technician satisfaction, and in churn risk.
How to actually audit your own ratio
Working through this in practice means going one level deeper than the headline number.
Step 1: Get the real denominator. Don't count endpoints - count managed work units. Weight servers at 2–3x workstations, and adjust for co-managed arrangements where a customer's internal IT carries actual load. Your RMM should be able to export this.
Step 2: Map your ticket sources. Pull 90 days of tickets and tag them by complexity tier (L1 = routine, procedural; L2 = requires judgment; L3 = project or escalation). A healthy distribution looks like 60% L1, 30% L2, 10% L3. If you're seeing 50%+ L2, either your triage is wrong or you're undersupporting L1.
Step 3: Identify your automation gaps. Which of your top 10 ticket types are handled manually that could be automated? Password resets, account unlocks, software installs, account provisioning - these are solvable problems. If your team is manually resolving them at scale, that's where your ratio leaks.
Step 4: Benchmark against your service model and size. Compare your ratio against the ISG benchmarking ranges and Datto's quartile data for MSPs at your scale, not the overall average. A 5-person MSP at 85:1 is in a different position than a 20-person MSP at 85:1.
Step 5: Decide whether to fix it from the top or the bottom. You can push the ratio up by automating more. You can also stabilize it by being selective about customer additions - saying no to customers who structurally don't fit your model. Both are valid. The worst move is neither - accepting whatever customers come and hoping headcount keeps pace.
The AI inflection point
Something genuinely new is happening at the top of the automation maturity curve. MSPs deploying AI agents that autonomously resolve tickets - not suggest solutions, but actually execute - are reporting ratio improvements that weren't achievable with RMM and scripting alone.
"Honestly, we're piloting an AI ticket agent right now. If it pans out, we could probably handle 200:1 without losing our minds. Most of our Level 1 stuff - password resets, VPN issues, printer drivers - it just handles now. We're not there yet, but I see it coming." - MSP owner, r/msp (2025)
The mechanism is straightforward: if an AI agent resolves 60–80% of Level 1 tickets before a technician ever opens them, the effective workload per managed endpoint drops significantly. A technician at 150:1 who only actively works 30–40% of those endpoints' issues is operating at an effective rate closer to 50:1 - well inside the sustainable zone.
The qualifier is real execution, not workflow suggestions. Tools that present technicians with next-step recommendations still require a human to read, decide, and act. That's not the same as an agent that resets the password, notifies the user, updates the ticket, and closes it - with no human in the loop.
"The benchmark will climb as RMM matures and AI takes more tickets. I'd expect 150–200:1 to become normal by 2027 for shops with proper automation. But the shops that burned out at 100:1? They'll still be burned out at 150:1 if they don't fix their tools and processes first." - MSP Operations Consultant, 2025
Try Rallied
Rallied is an AI technician built specifically for MSPs to handle the Level 1 tickets that consume your team's capacity - password resets, account unlocks, user onboarding and offboarding, MFA issues - without anyone opening the ticket. It connects to your PSA (ConnectWise, Autotask, Halo PSA), your RMM (Datto, NinjaRMM), and identity systems (Entra ID, Okta, JumpCloud, Google Workspace) and does the actual execution - no workflow builder, no months of setup. MSPs typically deploy it in under a week. At $3 per resolved ticket outcome (nothing charged if Rallied can't resolve it), the math on improving your endpoint-to-technician ratio is direct: fewer L1 tickets reaching your technicians means your existing team handles significantly more endpoints without burning out.
14-day free trial, no card required.
Frequently Asked Questions
What is a good endpoint-to-technician ratio for an MSP?
For most MSPs, the profitable sweet spot is 85–125 endpoints per technician, assuming competent RMM tooling, a balanced customer mix, and documented processes. Below 85:1 suggests underutilization; above 125:1 without strong automation is a burnout risk. AI-powered tools like Rallied are pushing sustainable ratios toward 150–250:1 by automating Level 1 resolution entirely.
What counts as an 'endpoint' in the endpoint-to-technician ratio?
Endpoints typically include any managed device: laptops, desktops, servers, virtual machines, mobile devices (if fully managed), and network infrastructure (routers, switches, firewalls) when under active management. The exact scope depends on your service agreements - co-managed arrangements may exclude customer-managed devices even if they're in your RMM.
How does automation affect how many endpoints a technician can manage?
Dramatically. Without any automation, a sustainable ratio is roughly 30–50:1. Basic RMM and patching automation gets you to 60–100:1. Advanced scripting and intelligent triage push that to 100–150:1. AI agents that autonomously resolve Level 1 tickets - password resets, account unlocks, onboarding - are enabling early adopters to operate at 150–300+:1. Rallied handles that last category end-to-end, resolving tickets without a technician ever opening them.
Why does my endpoint ratio feel unsustainable even though it looks fine on paper?
Because raw endpoint count is only half the story. Two MSPs at 100:1 can have completely different experiences depending on customer quality (SMBs with no internal IT vs. mid-market with a dedicated IT coordinator), ticket complexity (repetitive L1 vs. project-heavy L2), and automation maturity (manual vs. script-automated). A ratio that looks healthy in a spreadsheet can still destroy your team if the type of endpoints or customers underneath it is wrong.
What's the difference between endpoint-to-technician ratio and technician utilization?
The endpoint-to-technician ratio is a capacity metric - how many devices a technician is responsible for. Technician utilization is a productivity metric - what percentage of their working hours are billed or productive. A technician managing 120 endpoints with 80% automation has more breathing room than one managing 80 endpoints in a reactive, manual environment. Both matter, but confusing them leads to hiring decisions based on the wrong signal.