MSP help desk statistics: the 2026 benchmarks you should actually know

TL;DR
The MSP help desk is under more pressure than the numbers usually show. The industry average ticket resolution time is 3 days, 10 hours. Best-in-class MSPs resolve the same tickets in under 30 minutes. That gap isn't a mystery - it's a staffing and automation problem that's getting harder to paper over. Key benchmarks to know: SLA adherence target is 95%+, first contact resolution average is 70-84%, CSAT target is 75%+, and the practical ceiling for a helpdesk technician is 400-500 managed endpoints before SLA breaches start. At 150-190 tickets per week, burnout sets in. And 60% of MSPs already report moderate-to-severe burnout. The AI automation case is increasingly concrete: a 16x resolution time advantage on automated tickets, and tools like Rallied that handle 40-60% of L1 volume autonomously, deployed in the same week.
Why these numbers matter right now
The global managed services market hit roughly $390-430 billion in 2025, growing at nearly 10% annually. Almost 90% of SMBs either use an MSP or are actively considering one. Demand is going up. Staffing isn't keeping pace. Clients are getting more demanding - not less - about response times and resolution quality.
That's the macro context. But the operational reality is more specific, and more uncomfortable: most MSPs are running their help desks with metrics that obscure the real state of affairs. Executives and technicians don't see the same situation. Tools are disconnected. Burnout is climbing. And the window for fixing this with just "more hiring" is closing.
There's also a client expectation problem. SMBs are increasingly measuring their MSPs against the consumer-grade experience they get from SaaS products - instant notifications, self-service options, sub-hour resolution on basic requests. That's not a bar the traditional helpdesk model can clear at its current economics. The MSPs figuring this out fastest aren't just benchmarking their own numbers - they're using those benchmarks to justify structural changes: automation, tiered response models, and smarter routing before a human ever touches the ticket.
Understanding where your numbers land against real benchmarks is the first honest step.
Ticket volume: the burnout threshold no one talks about
Most help desk conversations start with raw ticket count. That's the wrong framing. Ticket count only becomes useful when you set it against the number of technicians carrying that load - and the type of work in the queue.
Here's what real MSP practitioners report from r/msp discussions:
- L1 helpdesk techs: 15-40 tickets per day is common, with wide variance by ticket type
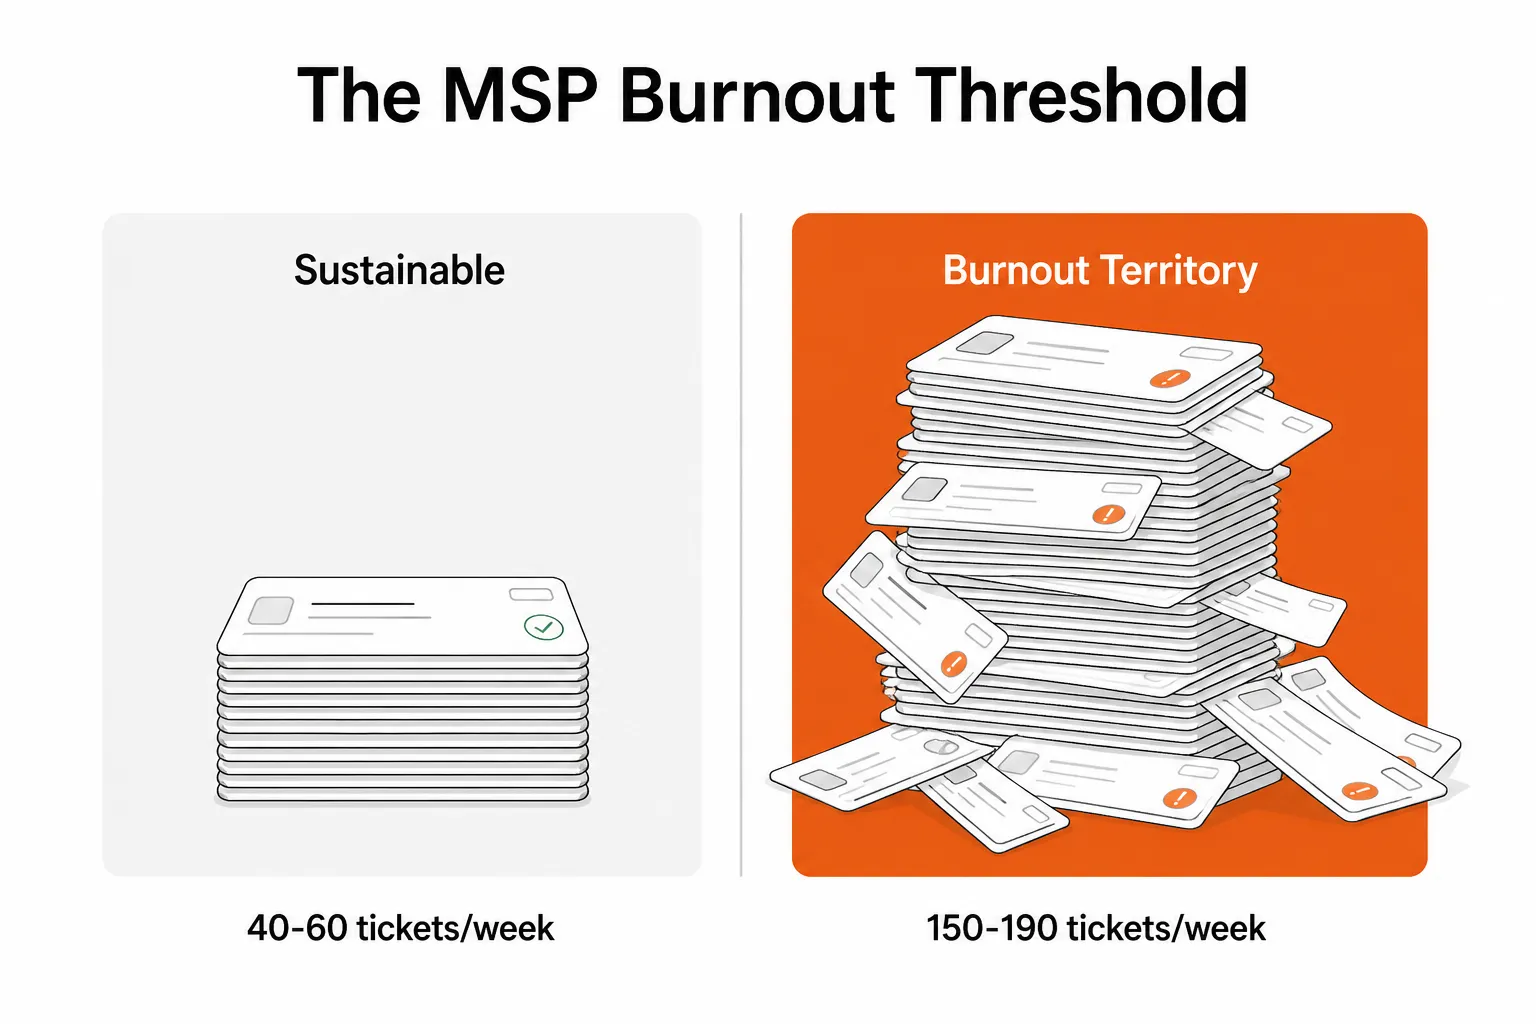
- 40-60 tickets per week per tech is the sustainable range for mixed workloads (including scheduled maintenance and documentation work)
- 150-190 tickets per week: reported burnout territory
- Queue depth of 200+ tickets: described as "unsustainable" by helpdesk managers
The burnout line isn't at 100 tickets or 200 - it's a function of ticket complexity and the backlog dynamic. One practitioner described the situation plainly: a junior tech managing 150-190 tickets a week with a 200-ticket backlog - "the burnout is hitting hard."
The more revealing metric is Fixify's 2026 benchmark finding that 22% of all help desk tickets represent work stoppages - employees literally cannot do their job until the ticket is resolved. For organizations with 1,000+ employees, that rate climbs to nearly one-third of all tickets. When you're measuring ticket volume, you're also measuring how much economic damage is sitting in your queue.
One more timing insight: 82% of tickets arrive during business hours, peaking at 11am, with Tuesday carrying nearly 25% of all weekly volume. Your Monday morning queue depth is not the problem - it's Tuesday's.
The KPI benchmarks that actually separate good from great
Most MSPs track ticket volume and response time. Fewer track the metrics that actually predict customer retention and technician longevity. Here's the landscape:
First contact resolution (FCR)
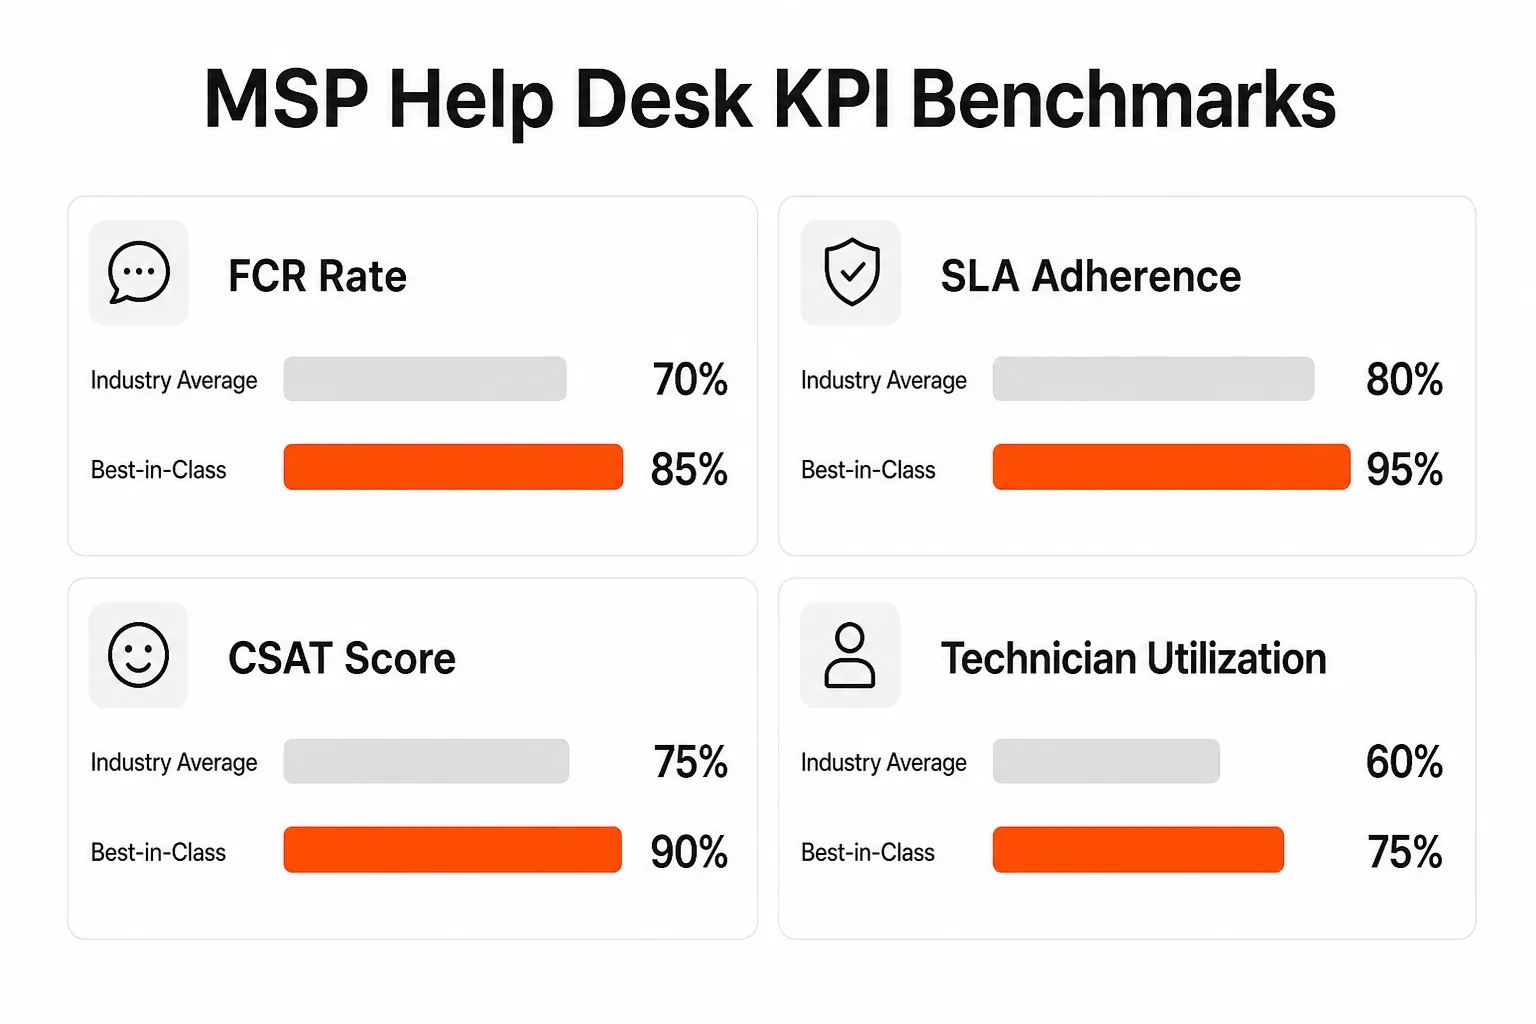
Desktop support organizations average 84% incident FCR worldwide. General call center benchmarks run lower, at 70-71%. Best-in-class contact centers target above 85%.
The gap between 70% and 84% FCR is not abstract. Every unresolved first-contact ticket reopens, consumes a second technician interaction, and often produces a frustrated user. 81.6% of tickets that started with negative user sentiment improved by resolution - but only when the ticket actually got resolved on first contact. Tickets that bounce between technicians don't recover as cleanly.
SLA adherence
The benchmark here is unambiguous: best-in-class MSPs stay consistently above 95%. Anything below that signals process gaps, not just staffing gaps.
The pressure point: clients are pushing for harder SLAs than most MSPs can realistically deliver. On r/msp, practitioners describe clients requesting sub-5-minute response times - with one manager noting it was "impossible with current staffing." Two-minute SLA requests get described as "not even doable." The honest move is renegotiating or repricing to cover the labor, not agreeing and missing.
Resolution time
This is where the variance is widest, and where the real performance gap lives:
| Benchmark | Resolution Time |
|---|---|
| Industry average | 3 days, 10 hours |
| Good median | Within 48 hours |
| Routine priority | 4-8 hours |
| Industry leaders (normal tickets) | Under 4 hours |
| Best-in-class | Under 30 minutes |
The jump from 48 hours to under 30 minutes is not incremental. It requires either dramatically different staffing or automation handling the tickets that are fast to resolve.
Customer satisfaction (CSAT)
MSPs should target at least 75% CSAT. Best-in-class reach 90% and above. The encouraging finding from Fixify's benchmark: most users aren't frustrated when they submit a ticket - but when they are, it's usually recoverable through timely, accurate resolution. That's an argument for speed and FCR over hand-holding.
Technician utilization
The industry target is 70-80% billable hours. Above 80% and there's no buffer for training, admin, or context-switching - which is when burnout follows. Below 70% suggests inefficient workflows or overstaffing. The ceiling matters: some MSPs report technicians getting only 2.5 of an expected 5 billable hours per day, with the rest consumed by queue management and context-switching overhead.
Staffing ratios: the numbers executives and technicians don't agree on
This is where the conversation gets uncomfortable.
The gold standard for mature, proactive MSPs is 350 fully managed endpoints per technician. Reactive shops run at 150-200. From r/msp:
- 400-500 endpoints per service desk tech is the practical upper limit for L1 helpdesk
- 750-1,000 endpoints per alignment engineer
- 2,000-2,500 per central administration engineer
Beyond 400-500 endpoints for an L1 tech, the ticket queue outpaces capacity, response times degrade, and SLA adherence starts to slip.
Now here's the uncomfortable part: a 2023 Kaseya MSP Benchmark Survey found that executives and technicians don't see the same situation.
Executives said the most common range was 101-250 endpoints per technician (27% of executives chose that range). Technicians said 26% of them manage over 750 endpoints. Only 8% of executives acknowledged technicians managing that many.
That's not a data problem. It's a visibility problem. And it's not small - it's the difference between a manageable workload and chronic overload.
For small MSPs, the math gets specific quickly. One practitioner described managing 150-300 users at $165/user/month with one technician, running 450 tickets per month at 72% billable utilization. At that scale, automation isn't optional - it's the only way the economics work.
Burnout and turnover: the real cost of unsustainable load
IT industry annual turnover runs 20-25%, well above the national average. A rate below 15% is considered healthy for MSPs - meaning most aren't hitting it.
The root cause isn't compensation (though that's real). It's workload structure:
- 60% of MSPs experience moderate-to-severe burnout
- Burnout triggers: juggling multiple clients, urgent tickets, chronic context-switching, queue anxiety
- The worst ticket types for frustration: network troubleshooting (39%), hardware troubleshooting (38%), OS issues (37%), application troubleshooting (31%)
The counterintuitive finding from practitioners: metrics can show "normal" ticket loads while technicians report being overwhelmed. Queue anxiety and context-switching cost don't show up in ticket counts. A tech managing 12 open tickets across 6 clients simultaneously is drowning even if none of those tickets are individually complex.
The hidden cost that rarely makes it into post-mortems: departing technicians take institutional knowledge with them. Client preferences, escalation quirks, workarounds for specific configurations - that information lives in someone's head until it doesn't. Turnover isn't just a recruiting cost, it's a knowledge drain that temporarily degrades service quality for every client the departing technician owned. MSPs that have moved to documentation-first workflows - IT Glue, Hudu, Notion - report shorter ramp times and better continuity when someone leaves. But documentation tools only help if your technicians have time to update them, which brings you back to ticket volume.
72% of service desks with a knowledge base report improved customer satisfaction, which is one lever. Reducing repetitive L1 volume is a bigger one.
What automation actually changes
The case for automating the L1 tier isn't speculative or theoretical anymore.
Fixify's 2026 benchmark - analyzing 50,000+ tickets across 30+ organizations over 14 months - found a 16x resolution time advantage on AI-automated tickets. That's not a marginal improvement. That's a different operating model.
A Kaseya survey found that among MSPs who invested in integrated tooling:
- 54% said fewer technicians were needed to manage the same workload
- 63% said integration enabled them to take on more clients and expand
- 68% of technicians said the tooling saves them time
- 56% said it enabled automated processes they couldn't have performed manually
The tickets worth automating first
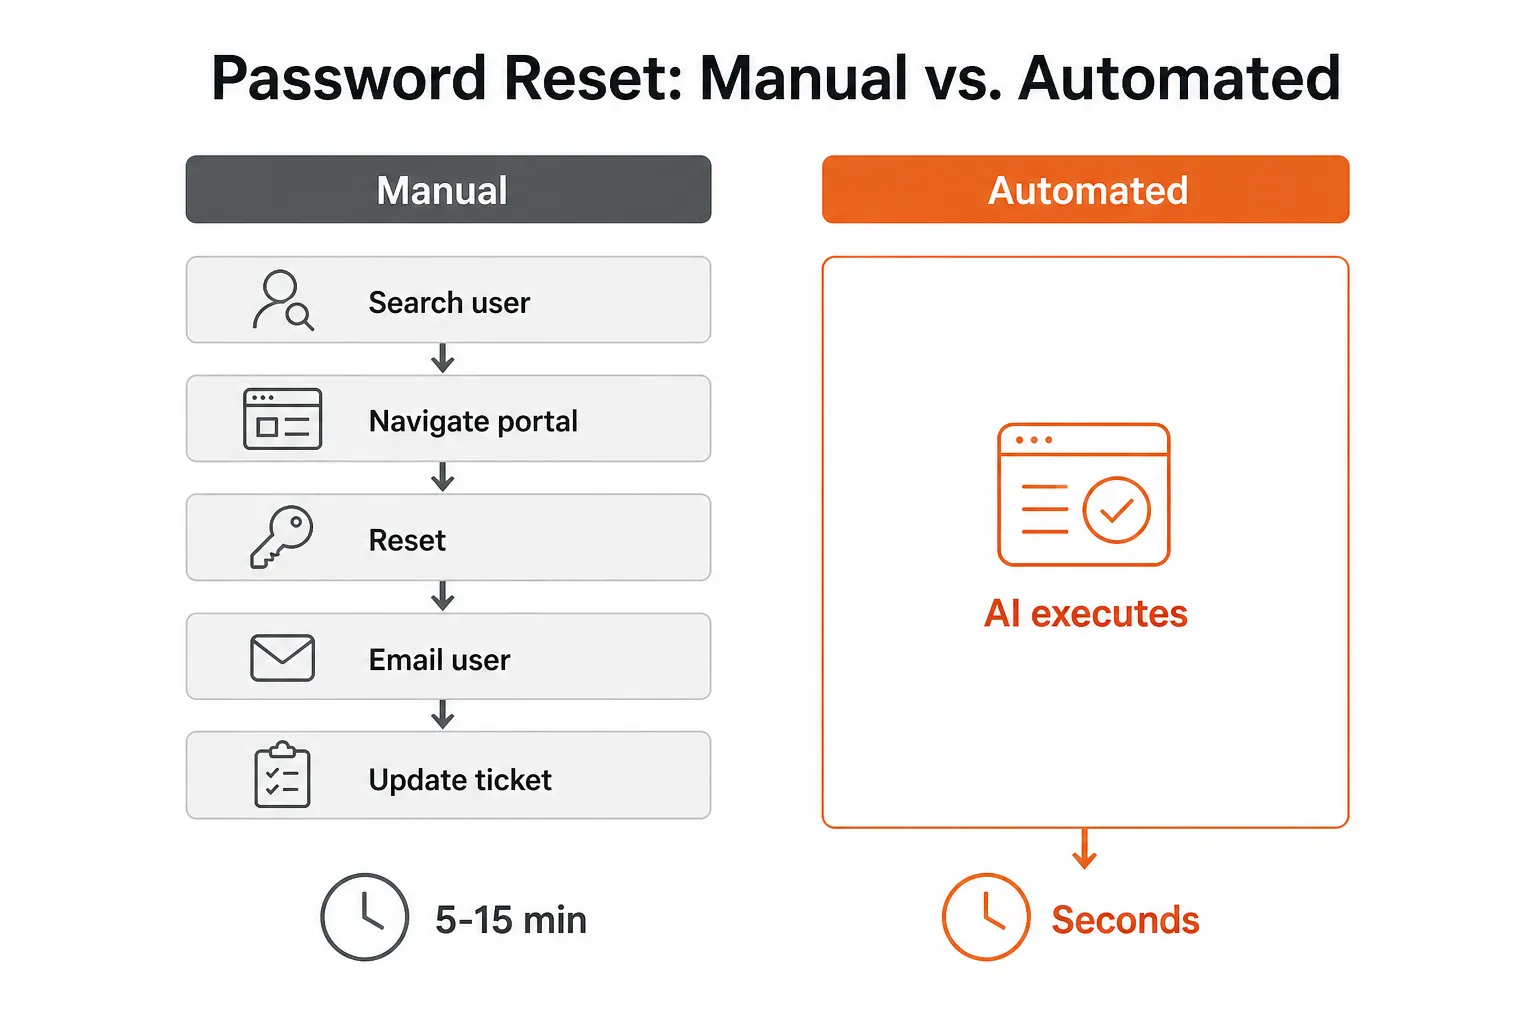
Not every ticket is equal. Password resets and account unlocks are the canonical starting point - they're ~18% of L1 ticket volume, each takes a human technician 5-15 minutes (navigate the identity platform, reset, email the user, update the ticket), and they're entirely deterministic. There's no judgment call. The resolution path is the same every time.
The same logic applies to:
- Permission and group membership requests - second largest L1 category after password resets; 5-20 minutes each manually
- Mailbox configuration - shared mailbox access, forwarding rules, out-of-office setup
- User onboarding/offboarding - 30-90 minutes per hire manually; fully scriptable
- Ticket triage and routing - routing delay adds latency before the actual fix even starts
If 40% of your ticket volume falls into deterministic L1 categories, automating them doesn't mean you need 40% fewer technicians - it means your existing technicians can handle 40% more clients, or can spend their hours on work that actually requires human judgment.
Try Rallied
Rallied is an AI technician built specifically for MSPs that actually executes L1 and some L2 tickets - not suggests them, executes them. It connects to your PSA (ConnectWise, HaloPSA, Autotask), your RMM (Datto, NinjaRMM), your identity systems (Entra ID, Okta, JumpCloud, Google Workspace), and your documentation tools (IT Glue, Hudu). When a password reset ticket arrives, Rallied resets the password, verifies access, notifies the user, and closes the ticket - in seconds, without a human opening it.
The pricing model matches how MSPs think: $3 per outcome, $150/month minimum. An outcome is a ticket where Rallied did real work - a changed state in one of your systems. No outcome, no charge. Most MSPs see deployment within the same week, with 40-60% of ticket volume handled autonomously once running. The ROI target is $7K-$15K per month in recovered technician time (50-100 hours of L1 work), and teams start in Plan Mode - watching Rallied's proposed actions before enabling full autonomous execution - so the rollout doesn't require a leap of faith.
For MSPs running at 400+ endpoints per tech, or watching their burnout metrics climb, the math on a $3-per-outcome model that handles 40% of volume is worth running.
Frequently Asked Questions
What is the industry average first contact resolution (FCR) rate for MSP help desks?
The industry average FCR rate for desktop support is 84%, while general call centers average 70-71%. Best-in-class contact centers target above 85%. Even a 5-10% improvement in FCR has a measurable impact on ticket volume, technician load, and customer satisfaction - fewer tickets get reopened, and technicians spend less time on the same issue twice.
How many tickets per week is too many for a helpdesk technician?
Based on real MSP practitioner reports from r/msp, 40-60 tickets per week is considered sustainable for a technician handling mixed ticket types. Once volume climbs to 150-190 tickets per week, burnout sets in rapidly - practitioners describe a 200-ticket backlog as 'unsustainable.' The ticket type matters as much as the count: password resets resolve in minutes, while network troubleshooting averages far longer per incident.
What is the ideal technician-to-endpoint ratio for an MSP?
The gold standard for mature, proactive MSPs is 350 fully managed endpoints per technician. Reactive shops typically run at 150-200 endpoints per tech. A Kaseya benchmark survey found a significant gap between what executives think (101-250 endpoints per tech) and what technicians actually manage - 26% reported handling over 750 endpoints.
How much can AI automation reduce MSP help desk ticket resolution time?
According to Fixify's 2026 IT Help Desk Benchmark Report, which analyzed 50,000+ tickets across 30+ organizations, AI automation delivers a 16x resolution time advantage. For specific ticket types like password resets - which account for roughly 18% of L1 volume - automation tools like Rallied handle the full workflow (reset, verify, notify, close) in seconds versus the 5-15 minutes a human technician typically takes.
What MSP help desk metrics should I track beyond ticket volume?
The metrics that actually tell you something are: SLA adherence (target 95%+, per LogMeIn benchmarks), first contact resolution rate (target 80%+), CSAT (target 75%+, best-in-class 90%+), mean time to resolution (target under 4 hours for normal priority), and technician utilization (70-80% billable hours). Queue depth and backlog growth are leading indicators of burnout risk worth monitoring weekly.